New Highs and Lows widgets allow traders to see the latest stocks reaching new highs or lows on the day to identify potential momentum.
These filters are hard-coded to display only the top 15 stocks priced between $1 and $20, with a minimum volume of 200,000 for the day intraday. (Pre-Market only matches the price criterion.)
By default, the New Highs and Lows are sorted by Last High/Low Time.
The columns displayed by default are as follows:
- Last High/Low Time
- Symbol
- Last
- % Chg
- Volume
You may add, remove, or sort columns as necessary, similar to our Scans and Custom Scans.
 |
 |
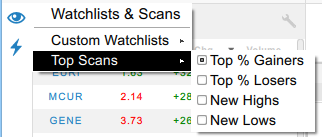
New highs and lows can be added by selecting them from the Watchlists & Scans menu:
You may use the Wrench Icon ( ) to hide the widgets.
| << 4.3 - Top % Gainers and Top % Losers | 4.5 - Custom Watchlists >> |
 Cam M.