StocksToTrade offers various tools to annotate the chart. These tools can be accessed by clicking on the Chart Tools icon:
![]()
This will show a list of the tools and options available to you:
Here is a brief description of the usage of each available option:
| Tool | Description |
Cursor ( ) ) |
The tool moves as the computer cursor, and as it moves along, it updates the data in the main chart table. This tool is used to pan the chart display (default behavior). |
Select ( ) ) |
The tool selects objects created with the chart tools. |
Line ( ) ) |
The tool allows you to draw a line on the chart. As you draw the line, a box appears, indicating the exact details of the line, such as the number of minutes, bars, percentages, points, and gradients it covered.
|
| Vertical Line () |
Draws a vertical line. |
| Horizontal Line () |
Draws a horizontal line. This analytical drawing tool indicates a particular price level. You can draw more than one in order to mark support and resistance levels. |
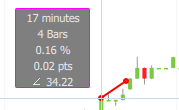
| Arrow ( |
Draws an arrow. As you draw the arrow, a box appears, indicating the exact details of the line, such as the number of minutes, bars, percentages, points, and gradients it covers.
|
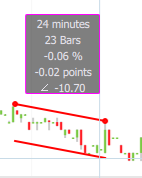
| Channel () |
Draws a channel on the chart. First, you draw a line, and as you do it, a box appears, indicating the exact details of the line, such as the number of minutes, bars, percentages, points, and gradient it covers. Then, you can draw the other channel line.
|
Rectangle ( ) ) |
Draws a rectangle on the chart. |
Oval ( ) ) |
Draws an oval shape on the chart. This is a non-analytical drawing tool for highlighting the necessary parts of a chart. |
Text ( ) ) |
Allows you to add text on the chart. |
Undo ( ) ) |
Undoes the last action. |
Redo ( ) ) |
Redoes the undone action. |
Selecting, Moving, and Deleting objects
To select an object that has been created on the chart (line, text, etc.), use the Select Tool from the Chart Tools dropdown.
Click on the desired object to select it.
- To delete, simply right-click on the selected object, then click on Delete
- To move, drag the selected object to the desired position by clicking on the object's body as a starting point.
- Note: you can move lines or any of the endpoints of the lines based on where you click.
Important Note: The Select Tool () remains active until you select the Cursor Tool () from the menu again. Not doing this will prevent you from panning the chart.
| << 3.3 - Chart styles | 3.5 - Chart Alerts >> |
 Cam M.