The article describes various technical indicators in stock trading, including Moving Average and Exponential Moving Average for price trends. Volume Average measures trading activity, while Bollinger Bands and RSI indicate price deviations and overbought/oversold conditions. MACD and Momentum assess price movement relationships, and Stochastic indicators analyze price statistics. VWAP and PPO present volume-weighted and percentage-based averages. Additional indicators like Pivot Points, Ichimoku Cloud, and Fibonacci Retracement identify support/resistance levels, while Parabolic SAR and ATR measure price direction and volatility.
|
Indicator |
Description |
|
|
|
|
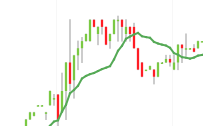
Moving average |
A moving average is a price-based indicator that calculates the average stock price over a specific number of periods. The available periods for calculation typically include 5, 10, and 20. The direction of the moving average carries significant insights into price trends. When the moving average is rising, it indicates a general uptrend in prices. Conversely, a falling moving average suggests that prices, on average, are declining. A rising long-term moving average signifies a long-term uptrend, while a falling long-term moving average indicates a long-term downtrend. |
|
Exponential moving average |
An exponential moving average is similar to a simple moving average, but it assigns greater importance to the most recent data. Due to its heightened responsiveness to new information compared to the simple moving average, the exponential moving average is favored by many technical traders. This enhanced responsiveness is one of the primary reasons it is their preferred choice among moving averages. |
|
Volume average |
Volume is the number of shares that trade over a given period of time, usually a day. The higher the volume, the more active the stock. |
|
Bollinger Bands |
The indicator shows two deviations from the moving average. |
|
RSI |
The Relative Strength Index indicator shows the overbought and oversold conditions of a stock. It ranges from 0 to 100. A stock is likely to be overbought once the RSI approaches the 70 level, meaning that it may be getting. Likewise, if the RSI approaches 30, it is an indication that the asset may be getting oversold and therefore likely to become undervalued. |
|
MACD |
The Moving Average Convergence Divergence momentum indicator shows the relationship between two moving averages of prices. The most commonly used values are 12, 26, and 9 days, that is, MACD (12,26,9). |
|
Momentum |
The indicator compares the relation of the current price to the price in the past. |
|
Stochastic Fast |
The indicator calculates the ratio of two closing price statistics: the difference between the latest closing price and the lowest price in a given number of last days over the difference between the highest and lowest prices in the last days. |
|
Stochastic Slow |
The indicator calculates the simple moving average of the Stochastic Fast statistic across given periods. |
|
VWAP |
The Volume-Weighted Average Price indicator provides the average price weighted by volume. It calculates the dollar value of all trading periods divided by the total trading volume for the current day.
|
|
PPO |
The Percentage Price Oscillator indicator that shows the relationship between two moving averages. The end result is a percentage that tells the trader where the short-term average is relative to the longer-term average. This allows a trader to use the PPO indicator to compare stocks with different prices more easily. For example, regardless of the stock's price, a PPO result of 20 means the short-term average is 20% above the long-term average. |
|
Pivot Points |
The indicator is the average of the high, low and closing prices from the previous trading day. |
|
Custom |
The application allows you to customize the existing indicators. For more details, see the procedures below. |
|
Ichimoku Cloud |
The Ichimoku Cloud is a collection of technical indicators that show support and resistance levels, as well as momentum and trend direction. |
|
Fibonacci Retracement |
Fibonacci Retracement levels are horizontal lines that indicate where support and resistance are likely to occur. |
|
Parabolic SAR |
The parabolic SAR is a technical indicator used to determine an asset's price direction and draw attention to when the price direction is changing. |
|
Average True Range |
ATR is a technical analysis indicator that measures volatility by decomposing the entire range of an asset price for that period. |
|
Awesome Oscillator |
The Awesome Oscillator (AO) is an indicator used to measure market momentum. |
|
Accumulation Distribution Line |
Accumulation/distribution (A/D) is an indicator that uses volume and price to assess the strength of a stock's price trend and spot potential reversals. |
|
Commodity Channel Index |
The Commodity Channel Index (CCI) is a technical indicator measuring the difference between current and historical average prices. |
|
Darvas Box |
Darvas Box is a technical tool that allows traders to target stocks with increasing trade volume. |
|
Oracle S&R Levels |
Shows signal and resistance levels. |
 Cam M.