This article demonstrates how to harness the power of Oracle… Our extremely powerful $3 million stock scanner.
Essentially, Oracle is an algorithm-based scanner that sifts through thousands of stocks every day using proprietary formulas, all with one goal in mind:
To pinpoint 20 stocks to watch with the potential for massive long and short breakouts.
During premarket, Oracle calculates which stocks to lock into its scanner…
And 2-5 mins after the market opens, it locks the 20 stocks in and calculates the Oracle data for these stocks.
Here is what each indicator means on the scanner once the data is locked in:
- Short or Long Bias
The scanner will let you know if it is bias long or short for a potential breakout based on the algorithm and the stock's momentum.
If it is highlighted green, it means the scanner is bias long for this stock.

If it is highlighted red, it means the scanner is bias short for this stock.

Keep in mind, although these 20 stocks stay the same on the Oracle scanner for the whole trading day after it locks in its data…
The bias could change throughout the day based on the stock's momentum and where the scanner feels the breakout play will be.
Next is…
- Signal Prices
Once the stock data is locked in at market open, the scanner will produce long and short signal prices for each stock on the scanner.
The signal price is the price the algorithm predicts needs to be reached for the predicted breakout to take place.

Make sure you are only paying attention to the signal price that is under the bias, long or short.
Oracle gives signals for short and long because the stock's momentum can change. Where a stock might have had a long breakout, it could become a better short play.
In other words, the Oracle Scanner plays both sides to help you find the breakouts up and down…
So you have multiple opportunities in any market condition.
Moving on…
- Support and Resistance
This area will use the stock's regular support and resistance levels but also give you what it predicts is a key support or resistance level to watch for.

To access all of the support and resistance levels, simply click on the stock ticker to open that stock's Oracle Point levels section.

You can see the support levels in red, the yellow midpoint, and the green resistance levels.
The key levels are circles, and the primary key is circled and highlighted.
You will also see numbers above those circled levels, and that is just letting you know how many times the stock hit that level during the trading day.
Next, we have…
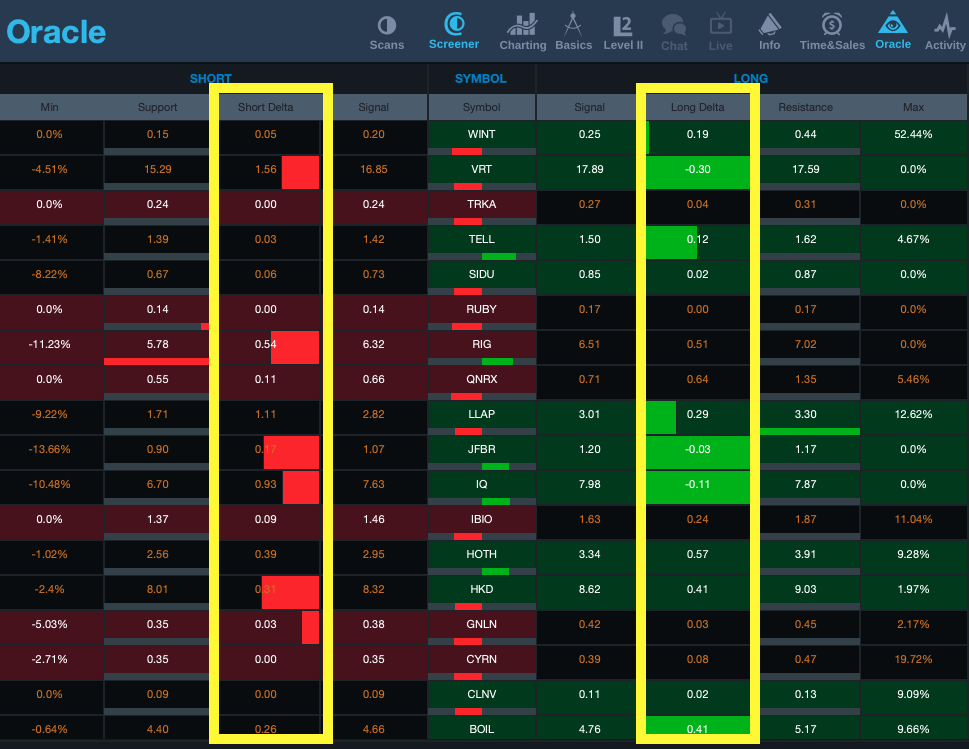
- Deltas
The deltas display the difference between the support/resistance levels and the signal prices.
The highlighted portion shows how close the signal price is to hitting the key support or resistance level.
- Min & Max
The Min and Max sections display the % change from the signal price.
If the stock has passed the key support or resistance level, then Min and Max will give you the % change from the signal price to the high or low of the day.
The primary purpose of this tool is to show you how the Oracle Signal predictions are performing.

- Stock Data
Lastly, inside the Stock Data section, you’ll find the normal stock data and indicators we feel most traders would like to know about the stocks in the scanner.
You will see the Last (which is the current price of the stock), the current % change of the stock from the previous day's close, and the current Volume, Float, and Market Cap.

For additional details about Oracle, please review the tutorial below:
To access the scanner, make sure you have downloaded the desktop application. Then click the plus symbol + to open a new tab, and there you will find the widget called “Oracle.”
If you have any further questions or concerns regarding Oracle, please don’t hesitate to reach out to our support team at support@stockstotrade.com.
 Bryce Davis